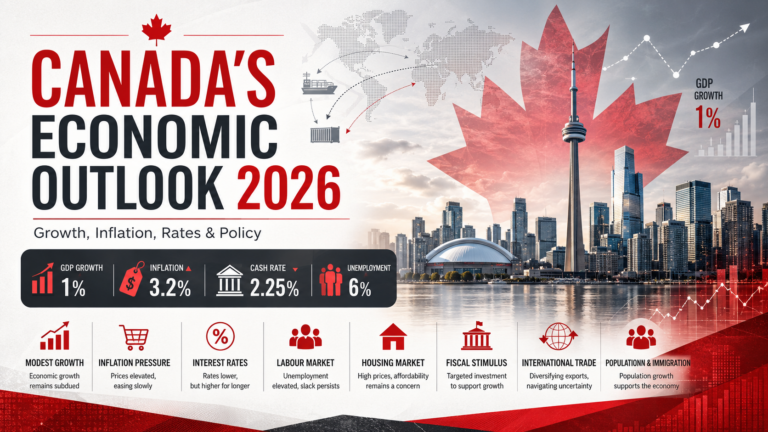

The construction industry contributes to Canada’s economic growth. It employs an estimated 1.6 million construction and trade workers, and demand for trained construction workers is consistently rising; they represent roughly 10% of the Canadian workforce. The fastest-growing construction market in 2026 is estimated to be valued at more than CAD200 billion.
However, the construction industry continues to face enormous challenges in 2026, most notably: rising construction material costs, constraints on sourcing construction materials, labor shortages in key trades, and cooling property demand.
This analysis examines the Building Construction Price Indexes for the first quarter of 2026, released on 28th April 2026 by Statistique Canada.
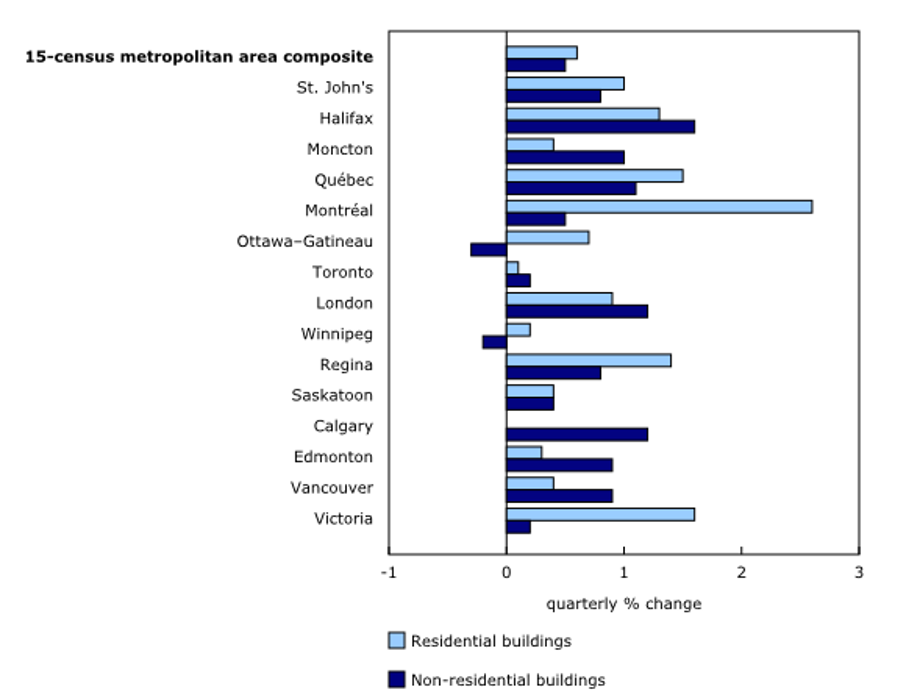
Building Construction Price Indexes, Quarterly Change, First Quarter of 2026
(Source: Table 18-10-0289-02 Building Construction Price Indexes by Type of Building and Division, Statistique Canada, 28th April, 2026, Canada – SunX Statistique Canada website access 06 July 2026)
| Building Construction Price Indexes, Quarterly Change, First Quarter of 2026, Quarterly % Change | Residential buildings | Non-residential buildings |
|---|---|---|
| 15-census metropolitan area composite | 0.6 | 0.5 |
| St. John's | 1 | 0.8 |
| Halifax | 1.3 | 1.6 |
| Moncton | 0.4 | 1 |
| Québec | 1.5 | 1.1 |
| Montréal | 2.6 | 0.5 |
| Ottawa–Gatineau | 0.7 | -0.3 |
| Toronto | 0.1 | 0.2 |
| London | 0.9 | 1.2 |
| Winnipeg | 0.2 | -0.2 |
| Regina | 1.4 | 0.8 |
| Saskatoon | 0.4 | 0.4 |
| Calgary | 0 | 1.2 |
| Edmonton | 0.3 | 0.9 |
| Vancouver | 0.4 | 0.9 |
| Victoria | 1.6 | 0.2 |
| Source(s): Table 18-10-0289-02. | ||
Building Construction Price Indexes, Quarter Change, First Quarter of 2026
(Source: Table 18-10-0289-02 Building Construction Price Indexes by Type of Building and Division, Statistique Canada, 28th April, 2026, Canada – SunX Statistique Canada website access 06 July 2026)
The cost of residential construction rose by 2.6% in Montreal, the largest increase, followed by Victoria, which saw a 1.6% increase. Quebec and Regina also experienced cost increases of 1.5% and 1.4%, respectively.
As for non-residential construction costs, Halifax led the cost hike at 1.6%. London and Calgary saw price rises of 1.2%, while Quebec experienced cost increases of 1.1%.
From Chart 1, it is apparent that most of Canada experienced a rise in construction costs in the first quarter of 2026.
| Investment in Building Construction | |
|---|---|
| Frequency: Monthly | |
| Table: 34-10-0293-01 | |
| Release date: 2026-06-22 | |
| Geography: Canada, Province or territory, Census metropolitan area, Census agglomeration, Census metropolitan area part | |
| Geography | Canada |
| Type of work | Types of work, total |
| Investment Value | Unadjusted - current |
| Type of structure | Apr-26 |
| Dollars | |
| Total residential and non-residential | 20,968,375,798 |
| Total residential | 14,103,485,806 |
| Single dwelling building total | 6,207,466,764 |
| Single | 5,931,606,854 |
| Mobile home | 21,898,152 |
| Cottage | 130,704,774 |
| Minor, Single | 123,256,984 |
| Multiple dwelling building total | 7,896,019,041 |
| Double | 339,289,969 |
| Row | 930,193,763 |
| Apartment | 6,606,332,173 |
| Minor, Multiple | 20,203,137 |
| Total non-residential | 6,864,889,992 |
| Total industrial | 1,375,149,349 |
| Factories, plants | 574,607,898 |
| Transportation, utilities | 473,533,963 |
| Mining and agriculture | 295,050,043 |
| Minor, industrial | 31,957,444 |
| Total commercial | 3,410,972,862 |
| Trade and services | 692,450,285 |
| Warehouses | 665,323,051 |
| Service stations | 47,164,881 |
| Office buildings | 940,051,371 |
| Recreation | 512,453,739 |
| Hotels, restaurants | 381,034,660 |
| Laboratories | 44,621,444 |
| Minor, commercial | 127,873,432 |
| Total institutional and governmental | 2,078,767,781 |
| Schools, education | 810,641,599 |
| Medical, hospital | 495,510,004 |
| Welfare, home | 529,874,747 |
| Churches, religion | 40,238,689 |
| Government buildings | 182,426,813 |
| Minor, institutional and government | 20,075,930 |
Investment in Building Construction, April 2026
(Source: Table 34-10-0293-01 Investment in Building Construction, Statistique Canada, 22th June, 2026, Canada – SunX Statistique Canada website access 06 July 2026)
According to the April 2026 data on investments in building construction, released on 22nd June 2026 by Statistique Canada, investments in building construction rose by 2.3%, which was a monthly increase of CAD 540 million to CAD 23.6 billion. Despite the rise in construction costs, the investments in building construction continued to grow.
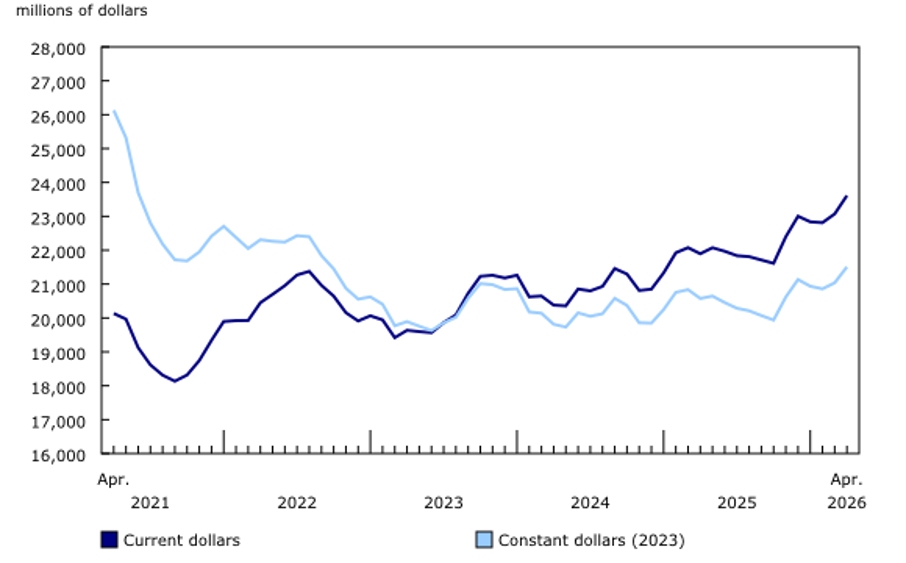
Investment in Building Construction Seasonally Adjusted
(Source: Table 34-10-0293-01 Investment in Building Construction, Statistique Canada, 22nd June, 2026, Canada – SunX Statistique Canada website access 06 July 2026)
| Investment in Building Construction Seasonally Adjusted (Millions of dollars) | ||
|---|---|---|
| Current dollars | Constant dollars (2023) | |
| Apr-21 | 20134 | 26130 |
| May-21 | 19966 | 25317 |
| Jun-21 | 19124 | 23697 |
| Jul-21 | 18617 | 22805 |
| Aug-21 | 18313 | 22180 |
| Sep-21 | 18135 | 21718 |
| Oct-21 | 18317 | 21686 |
| Nov-21 | 18744 | 21949 |
| Dec-21 | 19340 | 22416 |
| Jan-22 | 19896 | 22706 |
| Feb-22 | 19922 | 22378 |
| Mar-22 | 19926 | 22051 |
| Apr-22 | 20451 | 22310 |
| May-22 | 20698 | 22264 |
| Jun-22 | 20954 | 22240 |
| Jul-22 | 21269 | 22429 |
| Aug-22 | 21376 | 22398 |
| Sep-22 | 20963 | 21842 |
| Oct-22 | 20645 | 21448 |
| Nov-22 | 20157 | 20876 |
| Dec-22 | 19912 | 20556 |
| Jan-23 | 20065 | 20623 |
| Feb-23 | 19944 | 20404 |
| Mar-23 | 19420 | 19771 |
| Apr-23 | 19637 | 19893 |
| May-23 | 19598 | 19757 |
| Jun-23 | 19566 | 19630 |
| Jul-23 | 19861 | 19856 |
| Aug-23 | 20091 | 20018 |
| Sep-23 | 20728 | 20581 |
| Oct-23 | 21229 | 21016 |
| Nov-23 | 21261 | 20983 |
| Dec-23 | 21181 | 20842 |
| Jan-24 | 21262 | 20865 |
| Feb-24 | 20625 | 20178 |
| Mar-24 | 20648 | 20141 |
| Apr-24 | 20380 | 19815 |
| May-24 | 20359 | 19733 |
| Jun-24 | 20855 | 20151 |
| Jul-24 | 20800 | 20049 |
| Aug-24 | 20933 | 20126 |
| Sep-24 | 21459 | 20580 |
| Oct-24 | 21296 | 20370 |
| Nov-24 | 20811 | 19859 |
| Dec-24 | 20851 | 19849 |
| Jan-25 | 21330 | 20248 |
| Feb-25 | 21925 | 20755 |
| Mar-25 | 22075 | 20836 |
| Apr-25 | 21896 | 20576 |
| May-25 | 22073 | 20646 |
| Jun-25 | 21969 | 20455 |
| Jul-25 | 21839 | 20287 |
| Aug-25 | 21810 | 20212 |
| Sep-25 | 21712 | 20072 |
| Oct-25 | 21614 | 19939 |
| Nov-25 | 22398 | 20618 |
| Dec-25 | 23003 | 21135 |
| Jan-26 | 22838 | 20937 |
| Feb-26 | 22813 | 20860 |
| Mar-26 | 23072 | 21038 |
| Apr-26 | 23612 | 21507 |
| Source(s): Table 34-10-0293-01. | ||
Investment in Building Construction Seasonally Adjusted, April 2026
(Source: Table 34-10-0293-01 Investment in Building Construction, Statistique Canada, 22th June, 2026, Canada – SunX Statistique Canada website access 06 July 2026)
Residential building construction rose by 3.1%, while non-residential building construction experienced a moderate rise of 0.7%. Investment in building rose by 7.8% year-on-year during this reporting period in April.
Seasonally adjusted investments in building construction rose from January 2026 to April 2026, despite a rise in construction costs during this period.
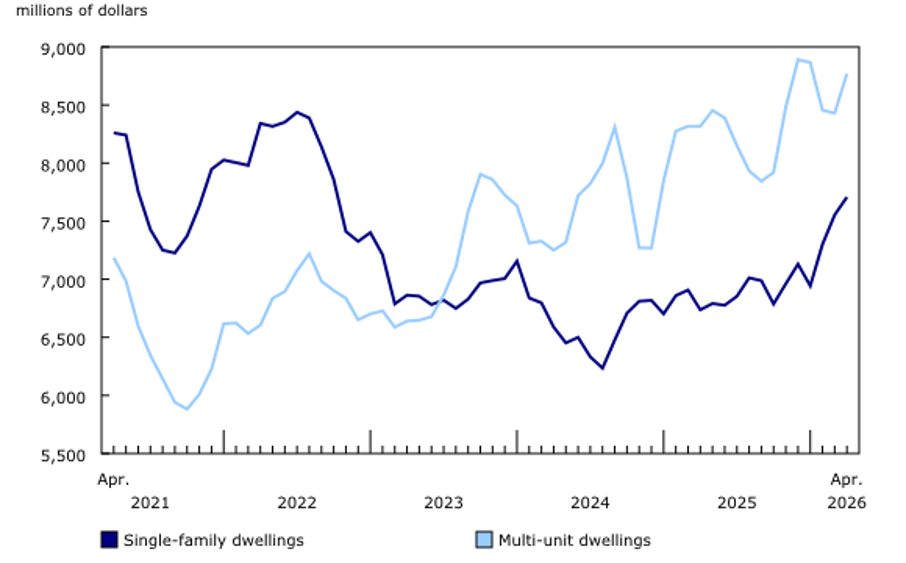
Investment in Residential Building Construction Seasonally Adjusted
(Source: Table 34-10-0293-01 Investment in Building Construction, Statistique Canada, 22nd June, 2026, Canada – SunX Statistique Canada website access 06 July 2026)
| Investment in Residential Building Construction Seasonally Adjusted (Millions of dollars) | ||
|---|---|---|
| Single-family dwellings | Multi-unit dwellings | |
| Apr-21 | 8260 | 7186 |
| May-21 | 8241 | 6985 |
| Jun-21 | 7753 | 6597 |
| Jul-21 | 7428 | 6345 |
| Aug-21 | 7251 | 6143 |
| Sep-21 | 7226 | 5941 |
| Oct-21 | 7372 | 5882 |
| Nov-21 | 7629 | 6010 |
| Dec-21 | 7947 | 6226 |
| Jan-22 | 8026 | 6617 |
| Feb-22 | 8004 | 6624 |
| Mar-22 | 7980 | 6533 |
| Apr-22 | 8341 | 6606 |
| May-22 | 8316 | 6836 |
| Jun-22 | 8352 | 6894 |
| Jul-22 | 8437 | 7074 |
| Aug-22 | 8388 | 7220 |
| Sep-22 | 8140 | 6982 |
| Oct-22 | 7859 | 6903 |
| Nov-22 | 7411 | 6836 |
| Dec-22 | 7326 | 6651 |
| Jan-23 | 7402 | 6701 |
| Feb-23 | 7211 | 6728 |
| Mar-23 | 6788 | 6587 |
| Apr-23 | 6863 | 6640 |
| May-23 | 6854 | 6647 |
| Jun-23 | 6782 | 6678 |
| Jul-23 | 6820 | 6863 |
| Aug-23 | 6749 | 7110 |
| Sep-23 | 6829 | 7582 |
| Oct-23 | 6968 | 7904 |
| Nov-23 | 6989 | 7858 |
| Dec-23 | 7006 | 7725 |
| Jan-24 | 7156 | 7632 |
| Feb-24 | 6839 | 7311 |
| Mar-24 | 6797 | 7328 |
| Apr-24 | 6589 | 7250 |
| May-24 | 6452 | 7319 |
| Jun-24 | 6500 | 7720 |
| Jul-24 | 6332 | 7823 |
| Aug-24 | 6235 | 7998 |
| Sep-24 | 6477 | 8308 |
| Oct-24 | 6708 | 7872 |
| Nov-24 | 6811 | 7271 |
| Dec-24 | 6818 | 7269 |
| Jan-25 | 6702 | 7849 |
| Feb-25 | 6859 | 8275 |
| Mar-25 | 6907 | 8317 |
| Apr-25 | 6737 | 8317 |
| May-25 | 6791 | 8453 |
| Jun-25 | 6776 | 8389 |
| Jul-25 | 6854 | 8150 |
| Aug-25 | 7012 | 7933 |
| Sep-25 | 6988 | 7844 |
| Oct-25 | 6787 | 7920 |
| Nov-25 | 6961 | 8483 |
| Dec-25 | 7130 | 8890 |
| Jan-26 | 6943 | 8866 |
| Feb-26 | 7300 | 8455 |
| Mar-26 | 7554 | 8430 |
| Apr-26 | 7707 | 8769 |
| Source(s): Table 34-10-0293-01. | ||
Investment in Residential Building Construction Seasonally Adjusted
(Source: Table 34-10-0293-01 Investment in Building Construction, Statistique Canada, 22nd June, 2026, Canada – SunX Statistique Canada website access 06 July 2026)
Multi-apartment construction was a key driver of increased investment in residential construction. Investment in multi-apartment construction rose by CAD338 million to CAD8.8 billion in April 2026, according to data on investments in building construction released on 22nd June 2026 by Statistique Canada. British Columbia led the increase, adding CAD231 million in new construction in April 2026.
In the same period, Quebec led single-family home construction, followed by Ontario. Quebec boosted new construction by CAD136 million, while Ontario added CAD83 million, and aggregate single-family construction rose by CAD153 million to a total of CAD7.7 billion during this period.
British Columbia led the increase in multi-apartment building construction. On the contrary, it also experienced the sharpest decline in single-family home construction, as cities were driven by the changing market dynamics.
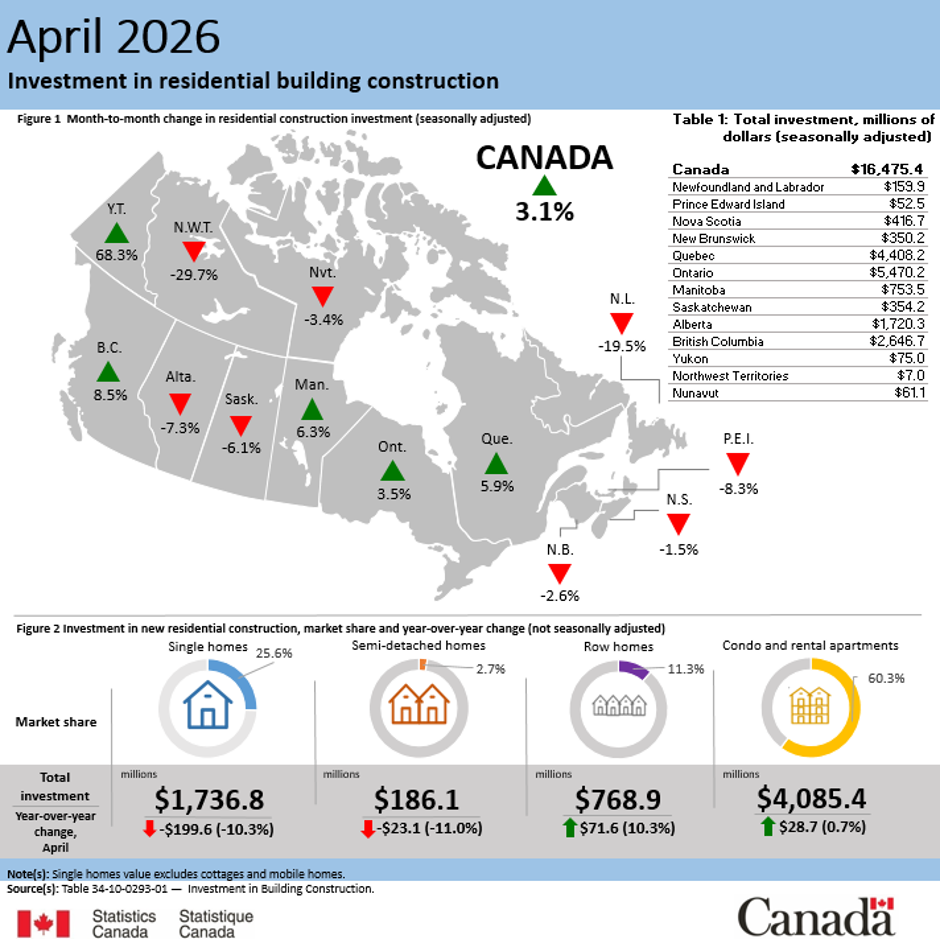
Investment in Residential Building Construction April 2026
(Source: Table 34-10-0293-01 Investment in Building Construction, Statistique Canada, 22nd June, 2026, Canada – SunX Statistique Canada website access 06 July 2026)
Data from infographic 1 show that Canadian investments in residential building construction rose by 3.1% to CAD16,654 million in April 2026. The largest month-to-month decline in residential building construction investment in April 2026 was in Newfoundland and Labrador, down 19.5%, and the largest increase was in Yukon, up 68.3%.
Monetarily, the decline in investment in Newfoundland and Labrador was CAD159 million, while the highest investment in Yukon was CAD75 million.
On a year-over-year basis, single-family home market share declined by 10.3% to 25.6%, resulting in a CAD199 million decline and bringing total investment to CAD1736 million.
SunX economist acknowledges the information, data, graphical and infographic, and Excel-format tabular sources from Statistique Canada, titled Investments Building Construction Price Indexes, Percent Change, Quarterly, with the table reference 18-10-0289-02 release date 28th April 2026 and Investment in Building Construction with table reference 34-10-0293-01 release date 22nd of June 2026, accessed by SunX on 6th of July 2026.
SunX Canadian Construction Industry Performance Forecast 2026
While construction costs have been rising, demand for multi-apartment construction is also rising, leading to an ongoing increase in investment in building construction and supporting the 2026 forecast.
Residential property development is significantly contributing to overall construction growth momentum despite internal and external economic shocks, most notably the rising cost of fuel due to the Middle East war that has affected the industry in the 2nd quarter of 2026, reinforcing the 2026 outlook.
A cooling residential property market, changing population demographics, and labor shortages are directly and negatively impacting the construction industry.
While investment in building construction is growing, the sector requires government interventions to address challenges such as labor shortages and to support market-stability policies.
SunX economist projects the industry will grow by 3.5% in 2026, unless the government adopts highly prescriptive, solution-oriented, resultant-driven policies to address macroeconomic issues affecting the construction industry and the wider Canadian economy.
For instance, the Bank of Canada could reduce the cash rate by 0.25% to stimulate the property market and the wider Canadian economy, while closely monitoring the inflation rate. If the initial 0.25% rate cut shows signs of market stimulation as intended and inflation remains below 3.0%, in line with the bank’s forecast, the economic managers could consider slashing the cash rate by a further 0.25%. However, if inflation rates rise, the bank may consider holding off on further rate cuts or raising the cash rate to contain inflationary pressures.
The immigration department should act immediately and prioritize labor intake visas to address worker shortages across industries. The primary purpose of the visa approvals will be that, upon arrival in Canada, the person must secure employment within the first month or, at the latest, in the second month.
The Department of Immigration should monitor each person’s employability and change its policies or eligibility criteria should the new arrivals fail to secure employment within the first two months of moving to Canada. The policy should not drive unemployment higher but rather focus on quickly filling job openings so that economic activity can accelerate further as consumer spending increases in proportion to new worker arrivals.
As part of a progressive new economic reform package, various ministerial departments should work as a unified team toward a common objective: improving the standard of living and quality of life by advancing economic prosperity for current and future generations.
To maintain a certain level of economic growth, it is vital for the nation to achieve the highest possible year-on-year economic growth, and Canada is well positioned to deliver exceptional economic performance.
The Bank of Canada’s economic managers and high-ranking ministerial officials of the Canadian government should work vigorously on realistic, practically achievable, problem-specific, outcome-based, solution-oriented policies that will give Canada an edge in economic growth amid its challenges.