Introduction
Fiji’s international merchandise trade data from 2010 to 2025 show that imports and exports have trended upward over the past 10 years.
Between 2020 and 2021, import and export values fell sharply, primarily due to unprecedented disruptions caused by the global pandemic on Fiji’s economy.
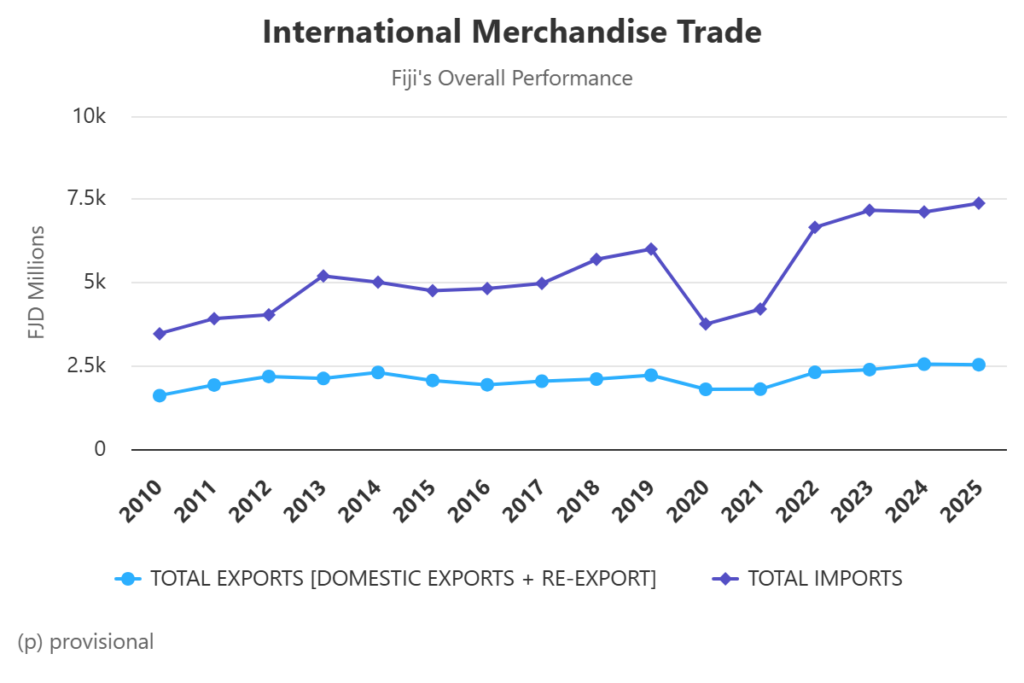
International Merchandise Trade – Fiji’s Overall Performance
(Source: FBoS, International Merchandise Trade Statistics, 2010-2025, July 2026, Fiji – SunX FBoS website access 9 July 2026)
| International Merchandise Trade | ||
|---|---|---|
| Category | TOTAL EXPORTS [DOMESTIC EXPORTS + RE-EXPORT] | TOTAL IMPORTS |
| 2010 | 1,605.40 | 3,464.60 |
| 2011 | 1,924.80 | 3,913.60 |
| 2012 | 2,181.70 | 4,030.70 |
| 2013 | 2,119.70 | 5,198.90 |
| 2014 | 2,302.20 | 5,012.60 |
| 2015 | 2,059.20 | 4,756.80 |
| 2016 | 1,930.90 | 4,820.10 |
| 2017 | 2,039.30 | 4,972.40 |
| 2018 | 2,102 | 5,696.70 |
| 2019 | 2,218.70 | 6,008.50 |
| 2020 | 1,795.10 | 3,754.30 |
| 2021 | 1,798.30 | 4,205.50 |
| 2022 | 2,305.20 | 6,662.10 |
| 2023 | 2,387.70 | 7,170.40 |
| 2024 | 2,549.50 | 7,122.40 |
| 2025 | 2,534 | 7,383.50 |
International Merchandise Trade – Fiji’s Overall Performance
(Source: FBoS, International Merchandise Trade Statistics, 2010-2025, July 2026, Fiji – SunX FBoS website access 9 July 2026)
International trade in services from 2012 to 2025 showed a consistently positive upward trend over the past 8 years, which closely correlated with merchandise trade for the period 2010 to 2025.
The global pandemic significantly affected trade services, as the relative value of service trade imports and exports declined during this brief period, inherently correlating with the merchandise trade trend.
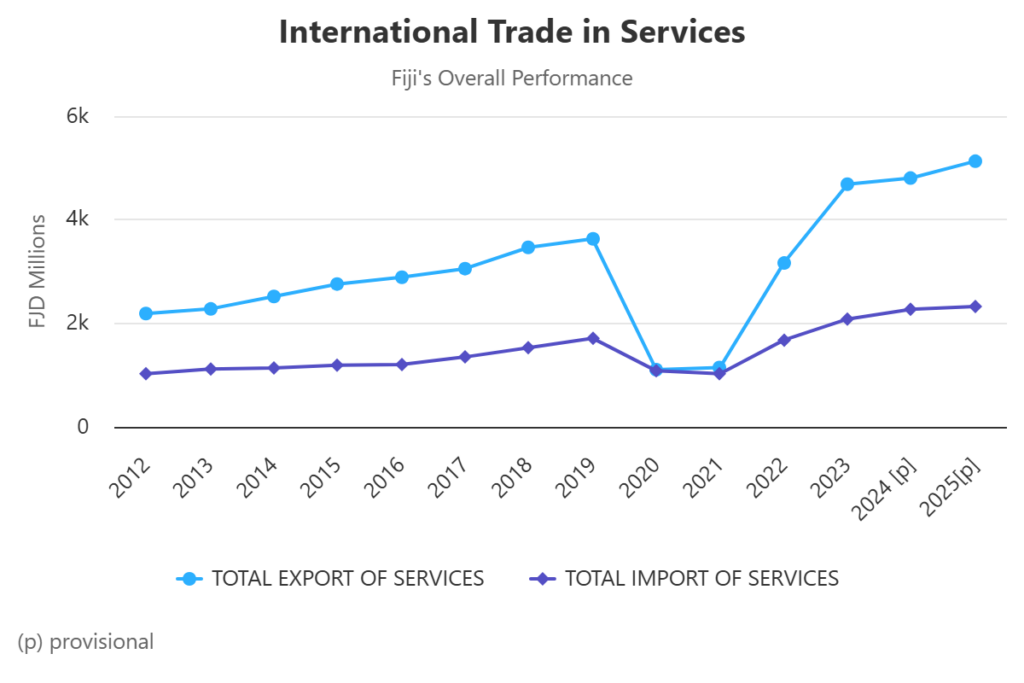
International Trade in Services – Fiji’s Overall Performance
(Source: FBoS, International Trade in Services Statistics, 2012-2025, July 2026, Fiji – SunX FBoS website access 9 July 2026)
| International Trade in Services | ||
|---|---|---|
| Category | TOTAL EXPORT OF SERVICES | TOTAL IMPORT OF SERVICES |
| 2012 | 2,188.40 | 1,028 |
| 2013 | 2,277.10 | 1,116 |
| 2014 | 2,517.90 | 1,139.30 |
| 2015 | 2,758.20 | 1,191.10 |
| 2016 | 2,888.90 | 1,203.40 |
| 2017 | 3,054.50 | 1,349.90 |
| 2018 | 3,465.80 | 1,527.90 |
| 2019 | 3,630.50 | 1,711.80 |
| 2020 | 1,104.20 | 1,082 |
| 2021 | 1,147.50 | 1,025.40 |
| 2022 | 3,163.40 | 1,675.10 |
| 2023 | 4,684.90 | 2,082.60 |
| 2024 | 4,804 | 2,271 |
| 2025 | 5,128.80 | 2,322.20 |
International Merchandise Trade – Fiji’s Overall Performance
(Source: FBoS, International Trade in Services Statistics, 2012-2025, 2010-2025, July 2026, Fiji – SunX FBoS website access 9 July 2026)
We will briefly review monthly data on international merchandise trade for March 2026 and quarterly data on international trade in services for March 2026, both from the Fiji Bureau of Statistics.
International Trade Merchandise
Fiji’s international merchandise trade statistics show that imports and exports grew in the March 2026 reporting period, as per FBoS No. 31, 2026 Statistical News (release date: 20th May 2026) on International Merchandise Trade Statistics.
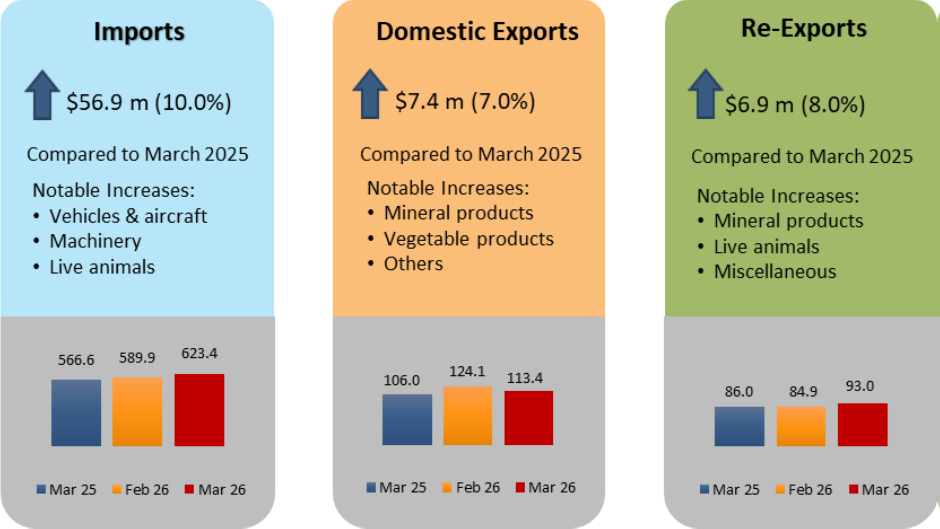
International Merchandise Trade March 2026
(Source: FBoS no 31, Statistical News, International Merchandise Trade Statistics, 20th May 2026, Fiji – SunX FBoS website access 9 July 2026)
Imports grew by 10% to FJD56.9 million, while domestic exports increased by 7% to FJD7.4 million and re-exports rose by 8% to FJD6.9 million in March 2026.
Notably, the origins of imports include China, Singapore, New Zealand, Australia and Japan. The country with the largest import volume was China, showing a monthly increase of 62.6%; in monetary terms, that increase was FJD53 million, bringing the total to FJD137.6 million. Automobiles, including electric vehicles, led the increase in import volume from China.
The second-highest origin of import volume by dollar value was Singapore, at FJD134.3 million. Fiji imported aviation fuel and diesel from Singapore.
Amid the US-led Iran-Israel war, global fuel supply disruptions were exacerbated and sparked fuel shortages.
Fiji took a decisive progressive step to secure fuel for current use. Additionally, it mitigated future fuel supply risks as the war escalated. The government ensured a consistently stable supply to meet the nation’s transport and manufacturing needs, and arranged for a guaranteed fuel supply for future use.
Turning to the export numbers, the top-earning exporting markets included the United States, Australia, China, New Zealand, and Vanuatu.
Kava and mahogany, in addition to other products, continued to drive high-value exports to the US s, which accounted for FJD36 million in export revenue and contributed to a 2.4% increase in export revenue, or FJD0.9 million in March, 2026.
China led the way in the highest monthly percentage increase in exports, at 92%, or an increase of FJD6.2 million in Gold ores and concentrates and mineral water, amongst other products, accounting for the total monthly export revenue at FJD14 million.
International Trade in Services Statistics
Fiji’s import and export services both grew in the first quarter of 2026, according to the international trade in services statistics for the March quarter 2026 from FBoS No. 47, 2026, Statistical News (release date: 3rd July 2026) on International Trade in Services Statistics.
Export services rose by 2.1%, a quarterly increase of FJD20.6 million, while import services rose by 9.5%, a quarterly increase of FJD54 million.
Transport services led the monthly export increase by 10%, or FJD42.7 million, driven by growth in air transport services.
Among import services, the largest monthly increase was recorded in government services, at 852%, or FJD30.7 million. The significant increase in monthly outlay was spent on embassy expenditures.
However, transport services accounted for the largest monthly import increase, at 15.4% or FJD39.6 million.
The review of Fiji’s overall performance data for the period March 2025 to March 2026, covering a period of 12 months, reveals the following interesting insights:
- Quarterly export figures continued to rise from the March 2025 volume of FJD975.9 million to FJD1,321.6 million in June 2025, then to FJD1,520.9 million in September 2025.
- Since the peak in export volume recorded in September 2025, Fiji’s quarterly export volumes have continued to decline gradually. The December quarter 2025 recorded a decline in export volume to FJD1,310.4 million, followed by a further quarterly decline to FJD996.50 million in March 2026.
- Import services reduced from the March 2025 quarter figure of FJD570.8 million to the June 2025 quarterly figure of FJD553.1 million.
- From the June 2025 quarter, import services volume has gradually risen, with the September 2025 quarter at FJD576.3 million, the December 2025 quarter at FJD622 million, and the March 2026 quarter at FJD624 million.8 million.
Fiji is a resource-rich country with readily available opportunities to inject vital capital into investments that generate high-quality, export-grade products for its existing and emerging global markets.
A reform package specifically designed to boost productivity in export-oriented products and services should be the key initiative for the Fiji government. The package should offer vital financial grants to businesses seeking to produce export-grade products and services, with a comprehensive focus on new set-ups and an emphasis on emerging markets.
The package should also focus on infrastructure development to support existing businesses, new start-ups, and most importantly, the emerging technological, AI, and robotics industry.
Foreign-generated export revenues are incredibly imperative to support Fiji’s ongoing economic growth and to lift the standard of living of its local residents.