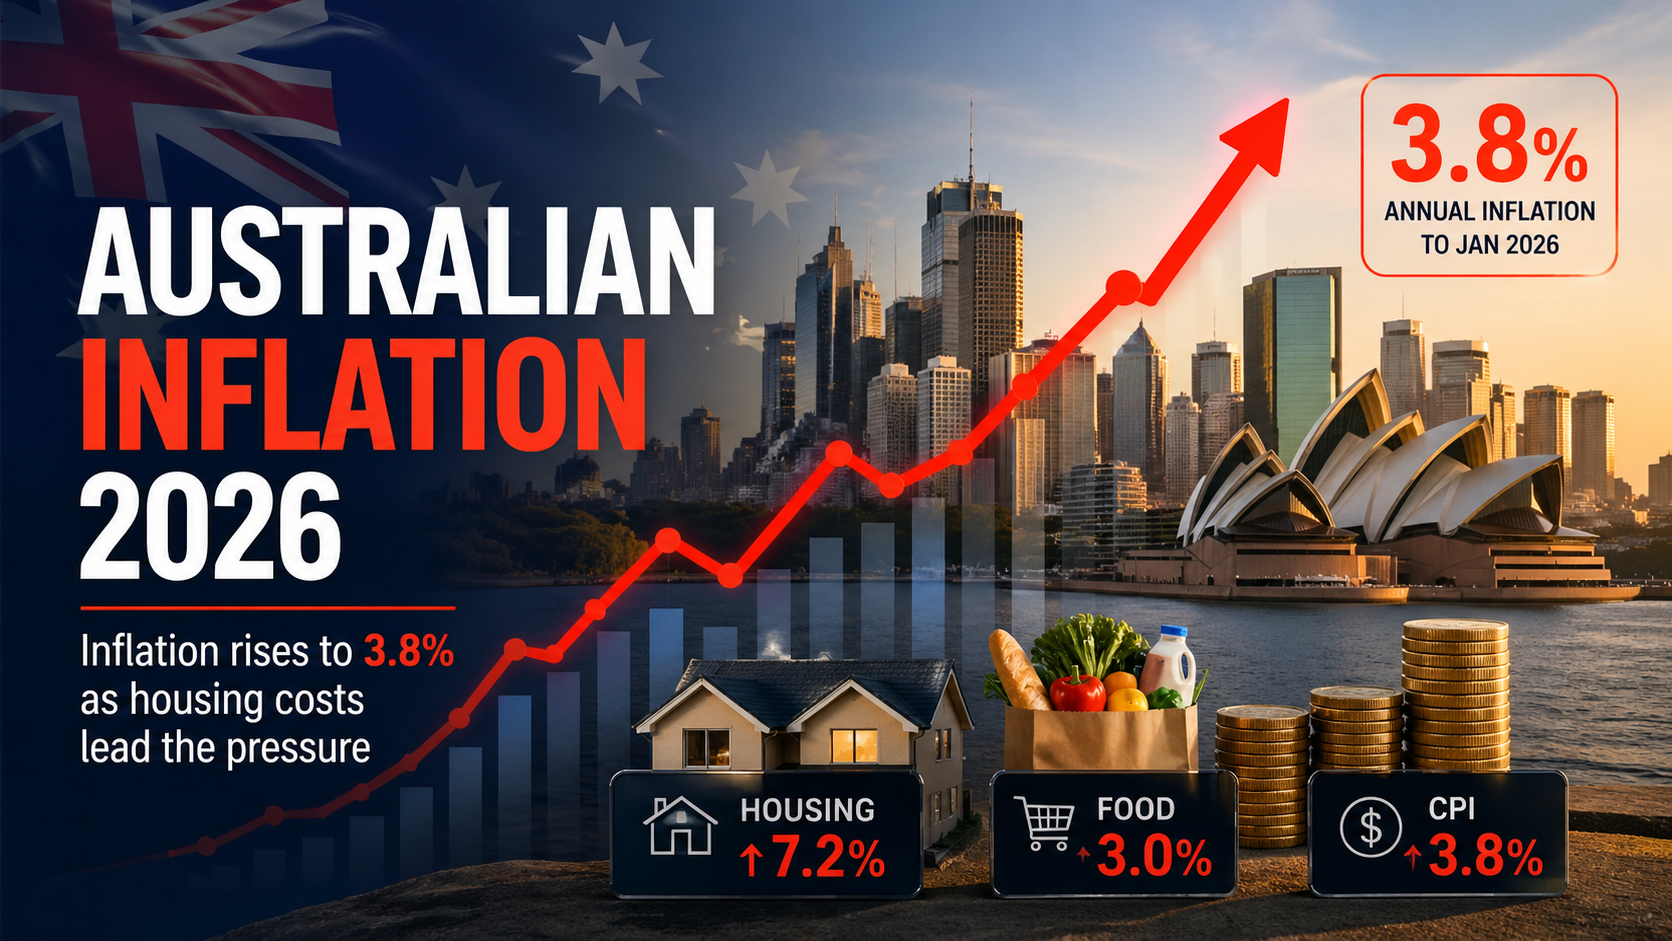
The Australian inflation rate, as expected, rose to 3.8% in the 12 months to January 2026 despite the RBA’s rate hikes to bring the inflation within its targeted rate. The rate has remained stubbornly above the RBA’s comfort zone of 2%-3%, with housing as the largest contributor at 7.2%.
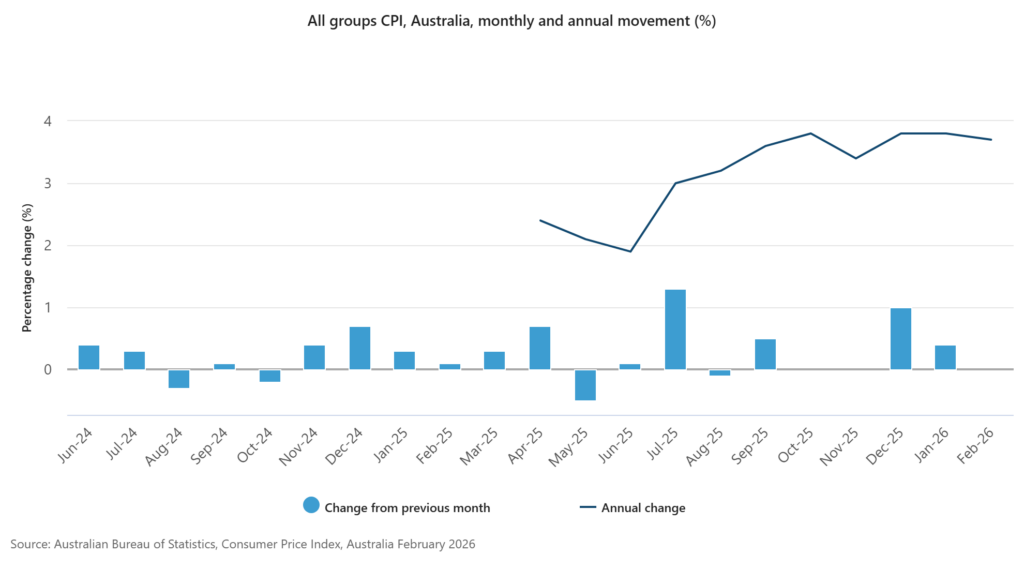
All Groups CPI , Australia, Monthly and Annual Movement
| Change from previous month (%) | Annual change (%) | |
|---|---|---|
| Jun-24 | 0.4 | |
| Jul-24 | 0.3 | |
| Aug-24 | -0.3 | |
| Sep-24 | 0.1 | |
| Oct-24 | -0.2 | |
| Nov-24 | 0.4 | |
| Dec-24 | 0.7 | |
| Jan-25 | 0.3 | |
| Feb-25 | 0.1 | |
| Mar-25 | 0.3 | |
| Apr-25 | 0.7 | 2.4 |
| May-25 | -0.5 | 2.1 |
| June-25 | 0.1 | 1.9 |
| Jul-25 | 1.3 | 3.0 |
| Aug-25 | -0.1 | 3.2 |
| Sep-25 | 0.5 | 3.6 |
| Oct-25 | 0.0 | 3.8 |
| Nov-25 | 0.0 | 3.4 |
| Dec-25 | 1.0 | 3.8 |
| Jan-26 | 0.4 | 3.8 |
| Feb-26 | 0.0 | 3.7 |
The demand for housing continues to surge, driving up the prices of residential dwellings and putting pressure on investment property rentals due to the housing stock shortages.
The demand for residential apartments and standalone dwellings continues to outpace supply due to the respective authorities’ process gaps in releasing new residential land or rezoning land to support the growing housing market demand, as well as the red tape and processes required to obtain timely construction permits and approvals.
While active efforts have been made across multiple government departments to expedite approval processes, gaps remain largely unaddressed, leading to ongoing housing shortages that are driving property prices.
Weighted Average of Eight Capital Cities
| Jan 26 to Feb 26(% change) | Feb 25 to Feb 26(% change) | Jan 26 to Feb 26(% change) | Feb 25 to Feb 26(% change) | |
|---|---|---|---|---|
| All Groups CPI | 0.0 | 3.7 | 0.2 | 3.7 |
| Food and non-alcoholic beverages | -0.1 | 3.1 | 0.1 | 3.1 |
| Alcohol and tobacco | 0.2 | 4.3 | 0.1 | 4.3 |
| Clothing and footwear | 2.6 | 5.0 | 0.3 | 4.9 |
| Housing | 0.3 | 7.2 | 0.7 | 7.3 |
| Furnishings, household equipment and services | 0.9 | 1.3 | -0.1 | 1.3 |
| Health | 0.1 | 3.2 | 0.3 | 3.2 |
| Transport | -0.7 | -0.2 | -0.6 | -0.2 |
| Communication | 0.2 | 0.8 | -0.1 | 0.8 |
| Recreation and culture | -3.0 | 4.1 | 0.6 | 4.0 |
| Education | 4.5 | 4.8 | 0.2 | 4.8 |
| Insurance and financial services | 0.1 | 2.4 | 0.3 | 2.4 |
| Weighted average of eight capital cities | Original | Seasonally adjusted |
Other contributors to inflation, based on ABS data, were food and non-alcoholic beverages (+3.1%) and recreation and culture (+4.1 %).
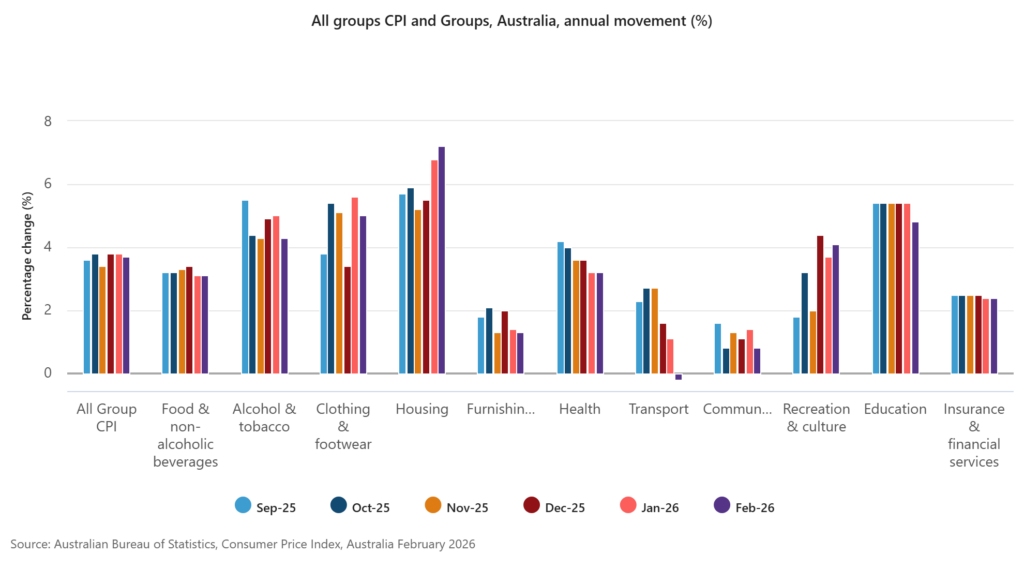
All Groups CPI and Groups, Australia, Annual Movement
| Sep-25 (%) | Oct-25 (%) | Nov-25 (%) | Dec-25 (%) | Jan-26 (%) | Feb-26 (%) | |
|---|---|---|---|---|---|---|
| All Group CPI | 3.6 | 3.8 | 3.4 | 3.8 | 3.8 | 3.7 |
| Food & non-alcoholic beverages | 3.2 | 3.2 | 3.3 | 3.4 | 3.1 | 3.1 |
| Alcohol & tobacco | 5.5 | 4.4 | 4.3 | 4.9 | 5.0 | 4.3 |
| Clothing & footwear | 3.8 | 5.4 | 5.1 | 3.4 | 5.6 | 5.0 |
| Housing | 5.7 | 5.9 | 5.2 | 5.5 | 6.8 | 7.2 |
| Furnishings, household equipment & services | 1.8 | 2.1 | 1.3 | 2.0 | 1.4 | 1.3 |
| Health | 4.2 | 4.0 | 3.6 | 3.6 | 3.2 | 3.2 |
| Transport | 2.3 | 2.7 | 2.7 | 1.6 | 1.1 | -0.2 |
| Communications | 1.6 | 0.8 | 1.3 | 1.1 | 1.4 | 0.8 |
| Recreation & culture | 1.8 | 3.2 | 2.0 | 4.4 | 3.7 | 4.1 |
| Education | 5.4 | 5.4 | 5.4 | 5.4 | 5.4 | 4.8 |
| Insurance & financial services | 2.5 | 2.5 | 2.5 | 2.5 | 2.4 | 2.4 |
As a consequence of ongoing inflation well above the target rate, the probability of imminent interest rate hikes is relatively high, adding to cost-of-living pressures and weighing heavily on already-constrained consumer budgets.
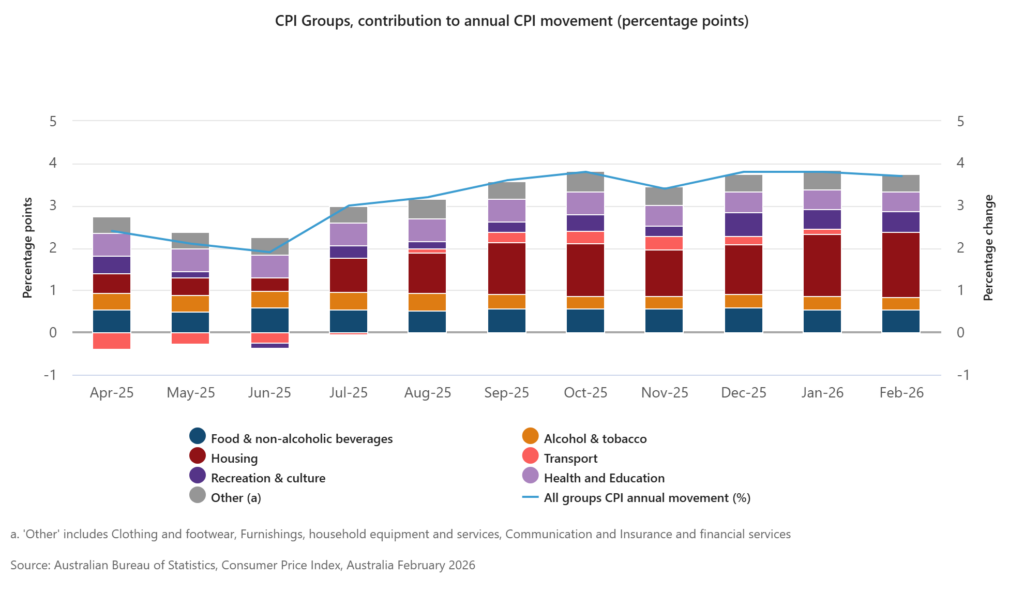
CPI Groups, Australia, Contribution to Annual CPI Movements (Percentage Points)
| CPI Groups, Contribution to Annual CPI Movement (Percentage Points) | ||||||||
|---|---|---|---|---|---|---|---|---|
| Dates | All groups CPI annual movement (%) (%) | Food & non-alcoholic beverages (Percentage points) | Alcohol & tobacco (Percentage points) | Housing (Percentage points) | Transport (Percentage points) | Recreation & culture (Percentage points) | Health and Education (Percentage points) | Other (a) (Percentage points) |
| Apr-25 | 2.4 | 0.5533 | 0.3796 | 0.4629 | -0.3771 | 0.4188 | 0.5461 | 0.3889 |
| May-25 | 2.1 | 0.4978 | 0.3942 | 0.4091 | -0.2695 | 0.1597 | 0.5251 | 0.3870 |
| Jun-25 | 1.9 | 0.5967 | 0.3786 | 0.3346 | -0.2424 | -0.1207 | 0.5201 | 0.4213 |
| Jul-25 | 3.0 | 0.5372 | 0.4294 | 0.7999 | -0.0403 | 0.3000 | 0.5232 | 0.4071 |
| Aug-25 | 3.2 | 0.5211 | 0.4029 | 0.9699 | 0.1048 | 0.1659 | 0.5320 | 0.4749 |
| Sep-25 | 3.6 | 0.5583 | 0.3636 | 1.2171 | 0.2528 | 0.2234 | 0.5362 | 0.4345 |
| Oct-25 | 3.8 | 0.5610 | 0.2919 | 1.2485 | 0.3041 | 0.3926 | 0.5277 | 0.4928 |
| Nov-25 | 3.4 | 0.5754 | 0.2787 | 1.1200 | 0.3006 | 0.2399 | 0.4981 | 0.4331 |
| Dec-25 | 3.8 | 0.5979 | 0.3169 | 1.1729 | 0.1853 | 0.5731 | 0.4900 | 0.4269 |
| Jan-26 | 3.8 | 0.5442 | 0.3281 | 1.4572 | 0.1252 | 0.4639 | 0.4722 | 0.4501 |
| Feb-26 | 3.7 | 0.5422 | 0.2829 | 1.5497 | -0.0215 | 0.5047 | 0.4534 | 0.4226 |
(Source: ABS, February 2026, Consumer Price Index, Australia – SunX ABS website access 23 April 2026)
SunX economist acknowledges the information, data, graphical, and excel format tabular sources from ABS, titled Consumer Price Index, Australia, with the reference period January 2026, accessed by SunX on 23rd of April 2026.
SunX Australian Inflation Forecast 2026
The US-Israel-led war on Iran, with the conflict spreading to Lebanon and causing destruction across the Gulf, has fractured parts of the global economy.
Global trade has been significantly impacted by a prolonged period of closure of a vital shipping route, the Strait of Hormuz.
Much of the world economy relies on the movement of goods and other vital resources, including oil tankers, which have been stranded by the closure of the Strait.
Australia is currently, as of April 2026, projecting a potential fuel shortage if tensions continue and the Strait closure persists. The supply of diesel will be further disrupted as the stock of oil previously transported through the Strait of Hormuz depletes globally, reducing the global fuel supplies.
Diesel is essential and in high demand to support the transportation and agricultural sectors in Australia, together with the high demand for fertilizers. The direct impact of the persistent closure of the Strait of Hormuz has led to higher fuel prices for Australian businesses in the short term.
The flow-on effect threatens to raise the prices of everyday grocery items, from essential agricultural produce to processed supermarket products. On the other hand, service-oriented businesses are also increasingly facing rising operational costs challenges.
Australia’s headline inflation is projected by SunX economist to reach 5.5% mid-year, driven by housing, food and non-alcoholic beverages, service inflation, and energy costs, if a unified resolution to the conflict is not reached by April 2026. For the same period, the SunX economist forecasts underlying inflation to be 4.3%.
However, if the ongoing conflict drags on into June 2026, it could increase the Australian headline inflation to 6%.
Compounding the escalating cost-of-living pressure is the projection of 2-3 times as many interest rate hikes in 2026. The Australian central bank’s monetary policy stipulation will be to act aggressively to contain already stubbornly high inflation, further decimating the real purchasing power of already highly constrained consumer budgets.
Although world opinion would vary widely on the timing of a cohesive action towards a peace agreement, the extensive deployment of the US Navy and ground forces, ready to act immediately on command, creates an imbalance in the opportunities for negotiations.
While consumer sentiment continues to decline amid eroding real purchasing power and elevated inflation, the Australian economy will invariably incur a high economic opportunity cost.
The resultant tangible impediments to economic growth will inevitably drive Australia into a period of slow growth across 2026, risking an economic downturn, with an economic rebound not expected until mid-2027.
However, if the crisis ends with a mutually executed, cohesive peace agreement between the US and Iran, as projected by the SunX economist for May-June 2026, the fuel supply will be gradually restored by the 3rd quarter of 2026.
This will, in turn, slightly relieve cost-of-living pressure, as the lagging effect of high production and transportation costs during the crisis and its subsequent recovery periods is passed through to retail prices that consumers pay at checkout.
Aligning with the gradual decline in production and transportation costs to pre-conflict levels and with the price adjustment filtering through the supply system, SunX’s economist projects that consumer spending will stabilize and that inflation will wind back to 3.9% by the 4th quarter of 2026.
The increases in construction material costs during the crisis period and its aftermath, and the consequent rise in house prices, will cast a cloud over any chance of a dramatic short-term decline in the inflation rate, thereby putting elevated pressure on inflation heading into 2027.
SunX economist forecasts the inflation rate to remain relatively high at 3.9% as 2026 draws to a close.
The Australian government has committed to exploring new fuel and fertilizer sources as a mitigating step to restore fuel and fertilizer supply and increase its fuel stock. The government’s steadfast action has contributed to stabilizing the fuel costs in the short term. The government’s continued international diplomatic strategies to increase fuel stocks will reduce fuel price increases and the upward pressure on inflation.
The year 2026 is apparently marked by greater global instability and market volatility, adding to an already unpredictable, chaotic international trading environment.
These external global shocks, in turn, have impacted the Australian investor confidence and consumer sentiment. These global shocks are projected to continue to disrupt the Australian economy in 2026, negatively affecting domestic economic activity.
The Reserve Bank of Australia’s monetary policy action will be on the path for an interest rate hike in the 4th quarter of 2026. The policy stance will be part of an aggressive policy initiative to contain upward inflationary pressures.
It will be imperative for the central bank to increase the cash rate twice, or a 3rd time, in 2026 to restore the highly anticipated economic stability heading into 2027.
Effectively targeted governmental policies and well-planned spontaneous interventions to external shocks that heavily weigh on Australians will be a key determinant in navigating extraordinary economic challenges and restoring balance within a structured economic contingency framework.